Wav3s by Blue Lab Audio: Visualize Sound in Three Dimensions
Have you ever wondered what sound looks like? How the spectral characteristics of your music change over time? For the most part, we rely solely on our hearing or on standard spectrum analyzers that show frequencies only at a specific moment. But what if you could see the evolution of sound in real time, in a captivating three-dimensional image?
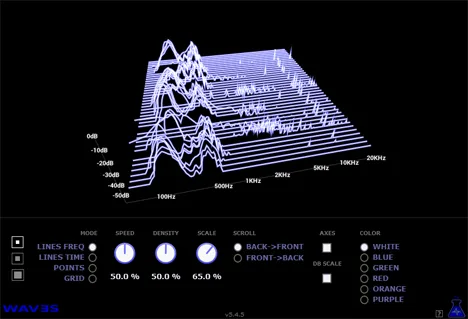
Introducing Wav3s – a unique plugin from Blue Lab Audio that transforms sound waves into an interactive 3D visualization. This tool is not an effect or an instrument in the traditional sense; it’s a powerful analytical tool that allows you to see sound from a whole new perspective. Essentially, Wav3s displays a so-called “waterfall plot,” which visualizes the frequency spectrum of a signal over time.
Imagine seeing how low frequencies slowly fade, how resonances rise and fall, or how different instruments “sit” in the frequency space throughout the track. Wav3s makes this possible, providing depth and dynamics to visual sound analysis that is impossible to achieve with two-dimensional graphs.
Key Features of Wav3s
The Wav3s plugin is designed with an emphasis on interactivity and flexible settings to provide maximum information and ease of use. Here’s what it offers:
- Interactive 3D view: Immerse yourself in a three-dimensional representation of sound that can be rotated and scaled with the mouse or trackpad. This gives you complete control over the point of view and allows you to thoroughly explore any aspect of the spectrum over time.
- Various display modes: Choose between different visualization styles, such as lines, grid, or dots, to find the one that best suits your analysis needs or simply aesthetic preferences.
- Flexible adjustment of visualization parameters: Control the scrolling speed of the graph, the density of data display, and the overall scale to optimize the visualization for specific audio material or task.
- Selection of the scrolling direction: Choose how the time axis will be displayed – from front to back or vice versa, which can be useful depending on your workflow.
- Display of frequency and dB axes: Clearly see where the frequencies are located and what level of loudness they have at any point on the graph.
- Color settings: Personalize the appearance of the visualization by choosing one of the available colors (white, green, purple, etc.).
- Different window sizes: Adjust the plugin window size to fit your workspace and needs.
Who is Wav3s for?
Wav3s will be a useful tool for sound engineers, producers, musicians, and audio engineers who want to better understand the spectral characteristics of their recordings or mixes. It’s a great tool for:
- Analyzing resonances and problematic frequencies in a mix that may manifest over time.
- Visually comparing the sound of different instruments or recordings.
- Studying how compression, equalization, or other effects affect the spectrum in dynamics.
- Simply for an exciting and innovative way to visualize music.
The Wav3s plugin from Blue Lab Audio offers a fresh perspective on sound visualization. It transforms complex audio data into an intuitive and interactive 3D image, making spectral analysis not only informative but also visually appealing. If you’re looking for a tool that will help you “see” sound in a new way and better understand its structure over time, Wav3s is a great choice.
Available in VST and AU formats for Windows (32/64 bit) and macOS, Wav3s easily integrates into most modern workstations. Try it, and you might discover aspects of your sound that you didn’t even know existed before.